This blog was written by UCSC students in ENVS-150/LGST-150A Coastal & Marine Policy: Dean Meiman, Ethan Kingery, Damiana Rojas, Tamalyn Ngyuen, Josh Stefanik, Emily Giraldo. Photo from Flickr.
San Mateo County’s beaches are beloved by visitors, from the pretty views at Linda Mar to the popular surf spot at Princeton Jetty in Half Moon Bay. Unfortunately, people are being unknowingly exposed to bacterial infection when they swim him.
As UC Santa Cruz students we set a goal to understand the sources of this issue and ways to address the problem. Working with a combination of water quality data from Surfrider’s Blue Water Task Force and San Mateo County Water Quality Monitoring Program, we conducted a data analysis to shed light on San Mateo County’s water quality issues. We also completed a literature review to explore this issue in depth. Our high level findings are:
- The beaches with the worst water quality are Capistrano and Linda Mar.
- Data collected at beaches where Surfrider tests water are more consistently dirty than beaches where the County collects data, suggesting that the County could expand their testing to these beaches.
- Sources of pollution likely vary at different beaches. The top known sources of pollution in the County are sanitary sewer systems, storm water runoff, horse facilities, and dog feces.
- Water quality conditions change throughout the year with high anomaly events. Over the past year, contributors to the worst water quality days include ‘first flush’ events of storm runoff after a long dry period, and blooms of algal mats caused by buildup of benthic bacteria.
- Solutions to this issue need to be varied, given the variety of sources of pollution. We propose solutions from the angle of policy, infrastructure and public outreach.
Analysis of Surfrider’s Volunteer Water Quality Data
Surfrider’s Blue Water Task Force is a volunteer-based initiative that tests and reports water quality all around coasts in the United States. The San Mateo Chapter tests six different county beaches for enterococcus, a bacteria that indicates fecal contamination in water. We analyzed the average levels of enterococcus at these six sites from January 2022 to February 2023, which produced the visual below that shows levels of enterococcus that are typically not safe for swimming - the Environmental Protection Agency’s threshold for ‘safe’ enterococcus levels in water are 104 bacterial units per 100ml of water. You can see that the vast majority of the data inputs are above this threshold.
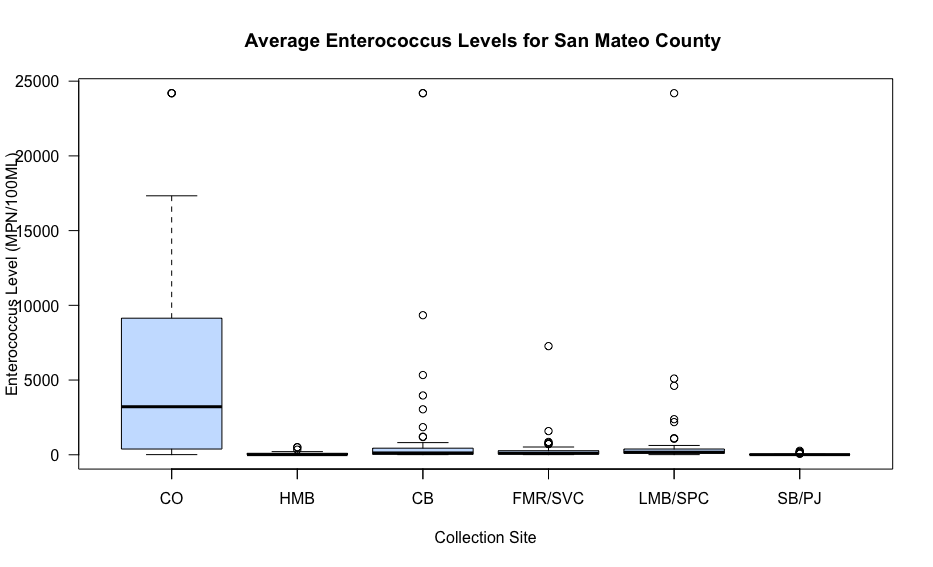
Figure 2. Enterococcus Readings from Surfrider’s Blue Water Task Force in San Mateo County (P>0.00000000000000125, F5,317=17.89, Tukey’s post-hoc comparison).
Capistrano Outfall in Half Moon Bay had the highest levels of enterococcus, followed by Capistrano Beach and Linda Mar Beach
An Analysis of Variance (AOV) found statistically significant differences in average enterococcus levels at the six different beaches, possibly indicating that there may be multiple sources of pollution that could be causing this difference. For example, ‘first flushes’ of runoff could be a problem at Linda Mar due to its close proximity to San Pedro Creek and the Anza Pump Station water treatment facility, while horse manure contamination from nearby ranches is a major problem at San Vicente Creek.
Analysis of the County of San Mateo’s Water Quality Data
Using a collection of data from the same time period (January 2022 - February 2023) recorded by the San Mateo County’s Water Quality Monitoring Program, we found that enterococcus levels are also high in other beaches outside of the locations where Surfrider tests for bacteria, though Surfrider’s testing sites generally show higher readings. This Analysis of Variance (AOV) shows us that the amount of bacteria varies between beaches and implies multiple sources of pollution, making it difficult to find the root of the issue and identify the main causes of high enterococcus levels in the ocean (Figure 3). This could also point to a potential challenge in finding solutions to poor water quality, as each beach’s local environmental factors could differ from one another and call for individualized management plans depending on each location.
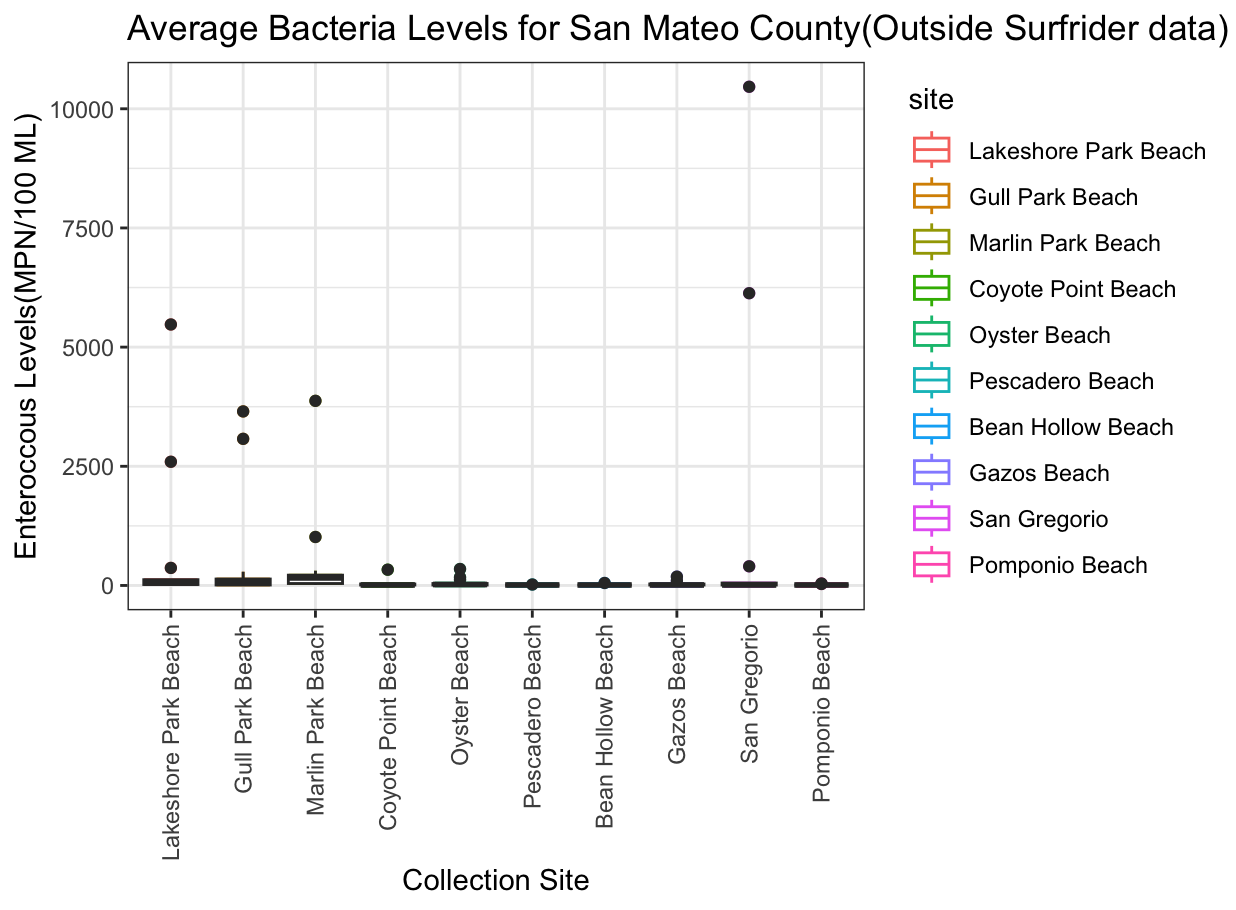
Figure 3. Average Bacteria Levels in San Mateo from San Mateo County Data. The differences in levels are statistically significant (AOV; P>0.00000000000000022, F9,120=1.604, Tukey’s post-hoc Comparison) indicating that there may be different causes of poor water quality at different beaches.
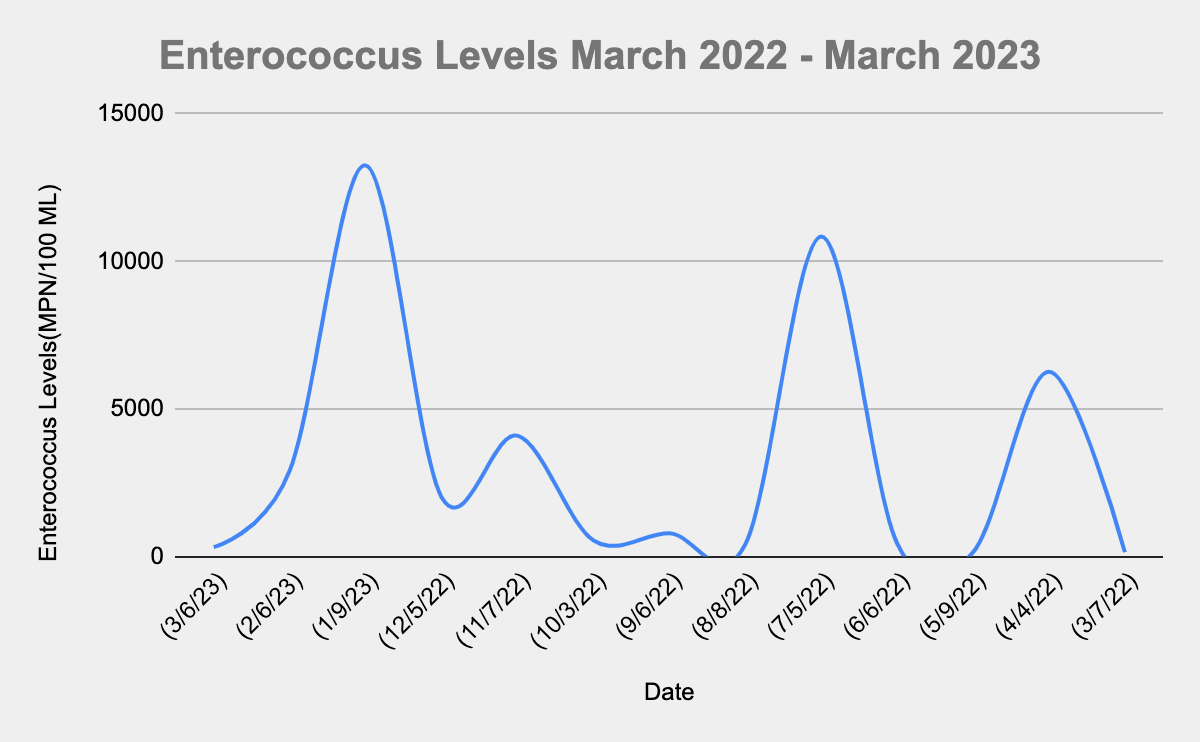
FIgure 4. Enterococcus levels over time, from San Mateo County’s Water Quality Monitoring Program.
Along with the Analysis of Variance, we created a line graph to see if there are any notable trends in enterococcus levels over time. While there is no significant trend to report, it is worth noting that rainy weather conditions generally contribute to higher enterococcus readings. The highest spike in enterococcus levels was recorded during January and February of 2023, which is when the coast of California was hit with heavy rainfall during winter storms. To complement the data analysis, we also did further research on the topic and created a literature review of San Mateo County water quality and the potential sources of enterococcus. Sanitary sewer systems and storm runoff can be sources of bacteria with potentially major contributions to low water quality. Sanitary sewer systems collect wastewater from homes and public spaces before treating it and releasing it back into our waterways. When these systems are ineffective or inadequately managed, bacteria can flow directly into the ocean. Storm drains can overflow due to heavy rainfall which intensifies the risk of wastewater flowing into the ocean. These are common sources of ocean pollution; however, there is not one source of bacteria that can be identified as the main contributor to low water quality along the coast, particularly since the County and Surfrider test for indicator bacteria that cannot 100% be linked to sewage. This lack of consensus on the topic creates a challenge for local policymakers and highlights a need for continued research.
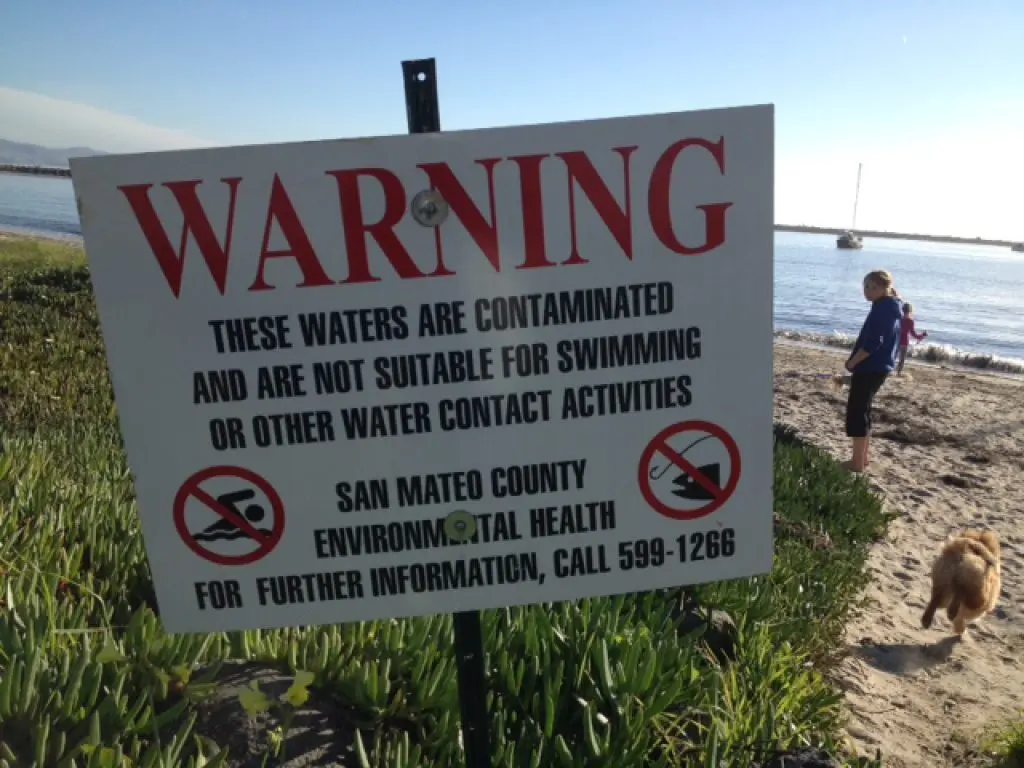
A sign at a Half Moon Bay beach warns visitors of post-storm contamination. https://patch.com/california/halfmoonbay/san-mateo-county-beach-closures-due-to-storm-related-32ace327a6
Low water quality is a consistent challenge faced by communities in San Mateo County. In 2020, environmental nonprofit Heal the Bay listed three San Mateo County beaches as ‘beach bummers’ on its Beach Bummer Report Card - making this County the worst water quality offender in the state according to the report card. Given the county’s common trend of being home to some of the most polluted beaches in the state, it is important to think about potential solutions to these issues. A complex problem requires multiple practical solutions. There is no correct answer to the challenge of bacteria in our beaches, but efforts in many areas could go a long way. Bay area voters can support initiatives such as larger-scale wastewater treatment projects or improvement of storm drain infrastructure. These solutions may require extensive funding and public awareness, which is why it is important to tackle them with community-focused efforts. Our top suggested solutions that individuals, policy makers, and water quality managers can consider are policies to ban and regulate the dumping of bacteria-carrying waste, consistently inspecting and fortifying sanitary sewer systems, and public outreach programs and local regulations regarding safe disposal of pet waste. Another potential solution to animal feces reaching the ocean could be working with horse facilities to create a system that repurposes manure for local gardening and composting projects.The efforts of organizations like Surfrider and their Blue Water Task Force must not go overlooked, as they will continue to keep communities informed about the potential threats of bacteria on our public beaches.
Literature Review - Summary of Heal the Bay's Report Card, 'Fifty' News Report, and a Water Board Study
Bay, H. T. (2022, August 20). Heal the Bay Releases Annual Beach Report Card & River Report Card 2022 - Heal the Bay. Heal the Bay. https://healthebay.org/beachreportcard2022/
Heal the Bay produces an annual water quality report card for all California beaches. Over the span of five years, San Mateo County has struggled with notoriously low water quality, which is well reflected in the report’s collected data. In the year 2020-2021, only 57% of the county's beaches received an A or B grade for the dry summer conditions. This is far below California’s average county’s water quality and is the lowest percentage in the state for the second consecutive year. San Mateo’s wet weather grades further solidified its low ranking status, with only 14% of the beaches receiving A and B grades. This is due to the ‘First Flush’, the initial surface runoff of a rainstorm, and its direct connection to the mobility of pollution into all forms of water systems. Many pollutants from transportation, waste discharge, and the industrialization of our cities are washed away into storm drains, creeks, rivers, and out into oceans. The winter dry grades were also at the bottom of the class and below the five year average, with only 45% of the county's beaches receiving A and B grades. This data correlates water quality to the trends of weather and levels of rainfall, but is not limited to these factors. The processes of how sanitary and sewer related systems as well as services interact with changing climates can be attributed to the degradation of San Mateo’s water resources. Human governance and management of water resources is a key influence in the future development of pollution in San Mateo.
Fifty, P. C. B. a. K. B. /. S. (2022, November 22). The mysterious case of the SF Peninsula’s poop-polluted beaches. Redwood City Pulse. https://www.rwcpulse.com/local-news/environment/the-mysterious-case-of-the-sf-peninsulas-poop-polluted-beaches-6141171
The main concern the authors of this report have when discussing water quality are the levels of fecal indicator bacteria, such as enterococcus and E. coli, which can have serious health consequences such as ear, skin, eye, and respiratory infections. Sources of these types of bacteria could be attributed to various potential sources such as sewers, livestock waste products, boaters, wildlife, etc resulting in difficulties tracing down the main source of such harmful pollution. Organizations such as Heal the Bay have credited runoff from storm drains as the biggest culvert for beach water pollution in California. Peninsulas in San Mateo are also home to year-round and seasonal creeks that bring runoff directly onto beaches as well.
Surfrider did a study of San Vicente creek, which flows into Fitzgerald’s beach, where volunteers walked from the mouth of the creek to the headwaters. Horse boarding facilities were found with manure piled up next to the creek indicating a definite source of pollution along with trailers emptying human waste into the water. To attempt to solve this problem the study group worked with landowners and residents and as a result, the bacteria counts declined significantly. Prior to this discovery, San Vicente would often hit 20,000 to 200,000 bacterial units per 100ml of water in comparison to safe fecal bacteria count set by the EPA as 104 bacterial units per 100ml of water. Localized plans and studies have shown to have an effect on bacterial count and sets up a precedent for further planning and mitigation.
Water Board, C. S. W. R. C. (n.d.). Home Page | California State Water Resources Control Board. https://www.waterboards.ca.gov/
Sewer laterals in the older neighborhoods of lower San Pedro Creek Valley are constructed of tar paper-like materials that have been dated to be more than 50-years old. These laterals long exceeded their life expectancy and are known to be leaking sewage into San Pedro Creek, highlighting the ongoing issue of poor sewage maintenance in relation to water quality. The study’s most significant findings included the pollutive inputs and runoff of horse pathogen indicator bacteria (E. coli) from stables and trails throughout all seasons. The BST study conducted by the Creek Coalition also summarizes that human sewage infrastructures, household pet waste, avian discharge, and wildlife waste forms as main water pollutant contributors in San Pedro Creek and Pacifica State Beach. These findings reinforce the need to address sanitary sewer systems failures, waste management practices at horse facilities, pet waste, stormwater runoff, and dry weather flows carrying bacterial pollution. San Pedro Creek discharges at Pacifica State Beach are a significant cause of impairment in this stretch of the Beach. In order to restore and protect the water quality at the Pacifica State Beach, it is crucial to control the bacteria sources in the San Pedro Creek watershed.